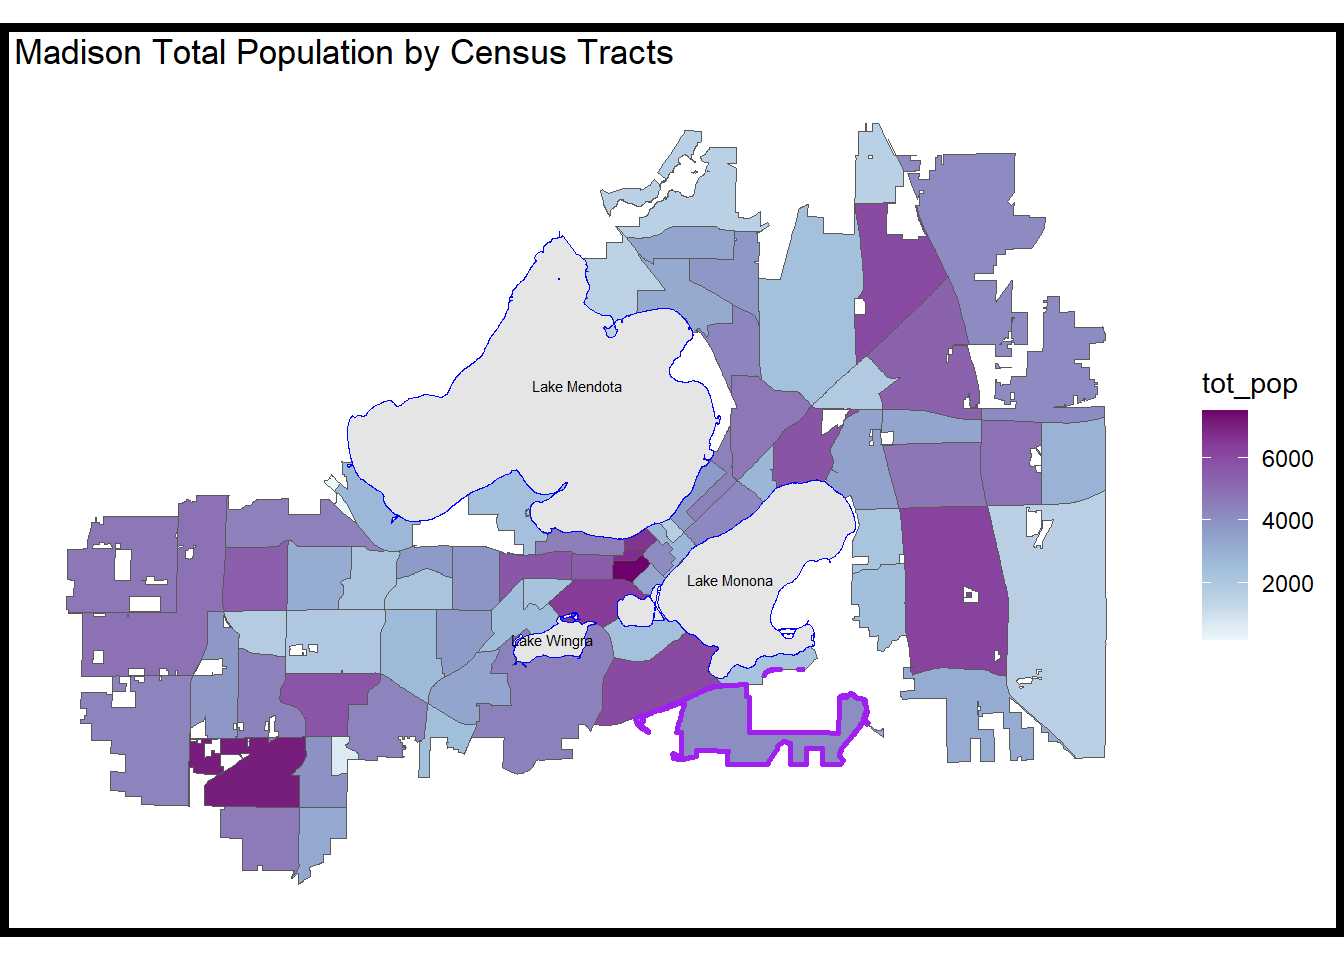
Neighborhood Indicators
This is the census tract that makes up our neighborhood.
This census tract is not a perfect fit for our neighborhood boundaries, but we can see that when we overlay on top of a map that the area covers all of our neighborhood boundary except the part that is in Fitchburg, and the excess area is mainly undeveloped save for the Highland Manor area, so it remains a decent representation of our neighborhood.
| 2024 Neighborhood Indicators | ||
| City of Madison | Badger Rock | |
|---|---|---|
| Census 2020 | ||
| Housing Units | 128493 | 1748 |
| Owner Occupied Homes | 44.5 % | 58.1 % |
| Total Population | 274730 | 4070 |
| Young Children: Age 0 to 4 | 5 % | 6 % |
| Youth Population: Age 0 to 17 | 16.4 % | 23.5 % |
| Senior Population: Age 65 and Over | 13.1 % | 9.7 % |
| White | 68.8 % | 42.4 % |
| Black or African American | 7.3 % | 16.1 % |
| Asian | 9.4 % | 5.3 % |
| Other Races or Multiracial | 5.4 % | 6.3 % |
| Hispanic or Latino | 9 % | 29.9 % |
| Total Households | 123052 | 1666 |
| Family Households | 55260 | 905 |
| Families with Children | 19 % | 28.8 % |
| Female Headed Families with Children | 3.8 % | 8.2 % |
| Housing | ||
| Land Area (acres) | 54227.7 | 1280.3 |
| Madison Dwelling Units | 139910 | 1810 |
| Campus Dwelling Units | 7169 | 0 |
| Community Pride Violations | 1657 | 28 |
| Madison Subsidized Rental Units | 7284 | 201 |
| Owner Occupied Houses: Average Value | 451395 | 333487 |
| Owner Occupied Houses: Square Foot Value | 237.35 | 206.77 |
| Non-Owner Occupied Houses: Average Value | 481261 | 327114 |
| Non-Owner Occupied Houses: Square Foot Value | 234.05 | 211.69 |
| Condos: Average Value | 304916 | 169449 |
| Condos: Square Foot Value | 237.07 | 172.29 |
| Median Rent | 1364 | -5 |
| Public Safety | ||
| Police Calls: Community Safety and Disorder | 12010 | 170 |
| Verified Criminal Offenses: Person Related | 2879 | 63 |
| Verified Criminal Offenses: Property Related | 8735 | 86 |
| Verified Criminal Offenses: Society Related | 15051 | 204 |
| Crashes | 2482 | 51 |
| Calls for EMS Service | 26334 | 436 |
| Calls for Fire Service | 15919 | 264 |
| Health | ||
| Infant Health: Pre-Term Births | 9 % | 10.2 % |
| Prenatal Care: Less than Adequate | 17.4 % | 22.4 % |
| Education | ||
| English Language Arts: Less than Proficient | 51.6 % | 79.7 % |
| Parent Education: Less than High School Diploma | 7.6 % | 14.9 % |
| Parent Education: Less than Bachelor's Degree | 49.3 % | 82.8 % |
| High Mobility Students | 7 % | 7.5 % |
| Economically Disadvantaged Students | 50.2 % | 78.1 % |
| Limited English Proficiency | 2.7 % | -5 % |
| Childcare Providers | 265 | 10 |
| Childcare Capacity | 12464 | 379 |
| Childcare Enrollment | 5705 | 136 |
| Economy | ||
| Median Household Income | 76983 | -5 |
| Families in Poverty | 6.6 % | 18.6 % |
| Unemployment | 2.7 % | 9.5 % |
| Basic Goods & Services (Pharmacies, Banking, Groceries) | P,B,G | B |
| Transportation | ||
| Low Transit Access | 27.4 % | 14.5 % |
| Available Transit Service | 8540 | 714 |
| Pavement Condition | 7.1 | 7.2 |
Values with a “-5” are missing data for at least one of the component block groups. Data were calculated if all data was present for each block group but was missing for the census tract.
Data Sources: